
Jinwoo Seo
Public safety is an essential aspect of urban design and an increasing urban population requires us to design a more effective and systematic plan for enhancing public safety. Fire service has a significant portion of responsibility for public safety and it provides various types of emergency and rescue services to the public. To understand the current condition of fire services in Northeast Los Angeles, I gathered the necessary data from the U.S. Census and the L.A. County GIS Data Portal and applied GIS tools for further study. Northeast Los Angeles is a densely populated urban area with a population size of 167,674 (U.S. Census 2000). My study area focuses on the city of Los Angeles Eagle Rock, Glassell Park, Highland Park, Mount Washington, and Montecito Heights (Total population of 143,022). While I prepared the maps, I applied two network analysis techniques: network distance and location-allocation to achieve the fire service area and potential location for a new fire station.
Map 1
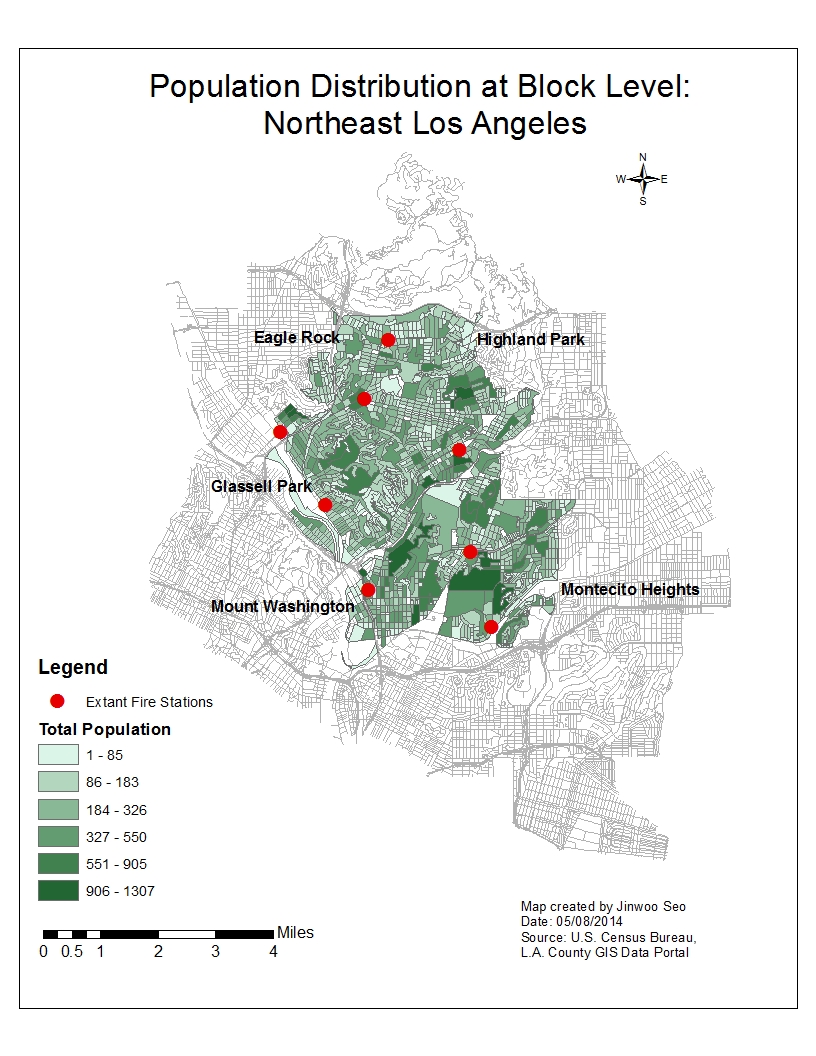
Location of public safety facilities is critical in serving the neighborhood, particularly in an urban setting. To be more efficient, fire stations should have sufficient coverage of the population size within their service areas. Map 1 presents the population distribution of the subject area at block level. Since the population is not normalized by land area, larger blocks tend to show higher population sizes. Larger blocks in the map usually indicate suburban residential neighborhoods while smaller blocks imply denser downtown areas. This block population data was used in the later step for calculating demands for a new fire station.
 Map 2
Map 2
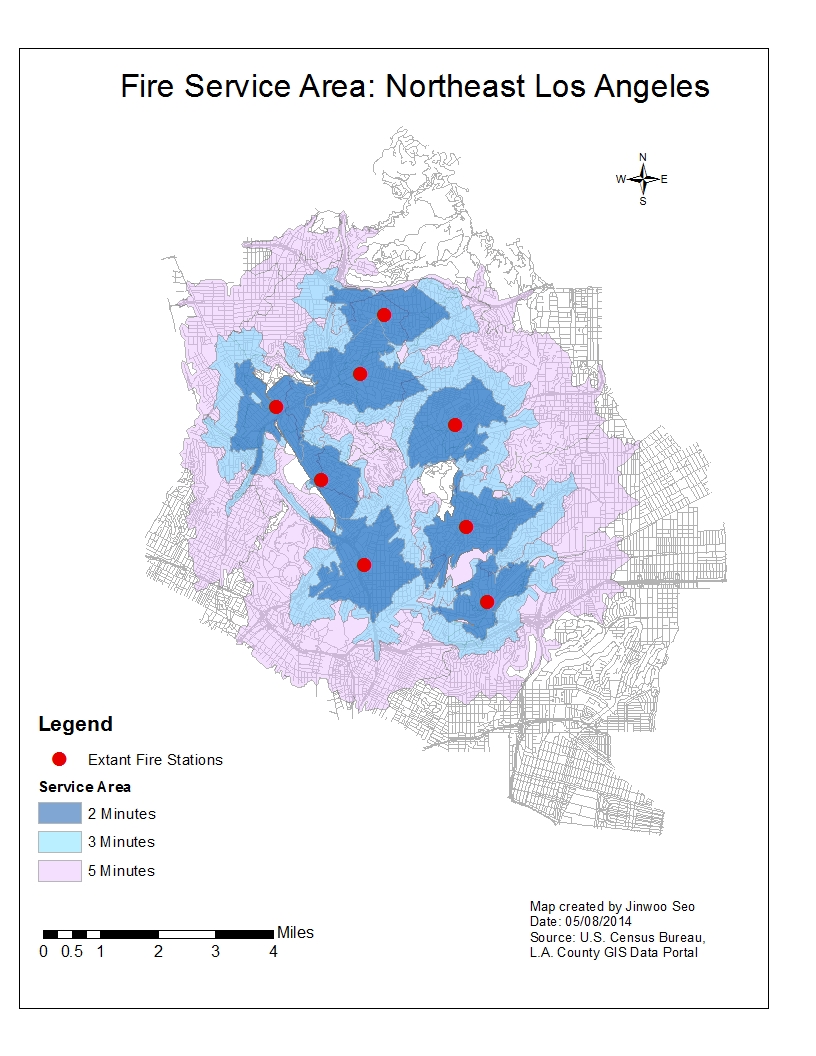
According to the U.S. Department of Homeland Security, response time is usually measured from the time a call was received by the emergency communications center to the time the fire apparatus arrives at the scene. However, due to data limitation, I used drive time as my main factor determining the response time. Thus, the five-minute service area illustrates the area coverage by five minutes of drive time from each fire department.
To visualize the service area of each station, I created service areas of two minutes, three minutes, and five minutes. As shown in Map 2, the three-minute service area shows a significant portion of the center area uncovered by any fire departments. However, the result of the analysis shows good coverage of service areas within five minutes response time. The blank portions within the service area are regional parks and mountain areas and no road networks are provided on the site.
Map 3
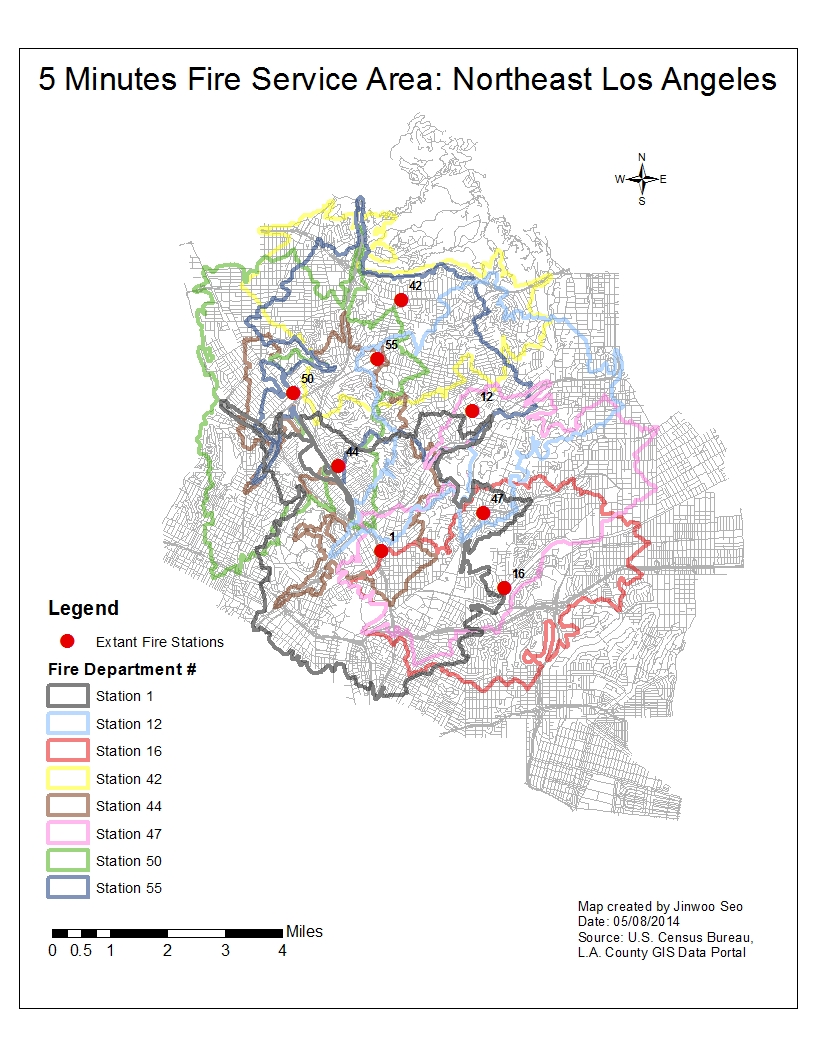
In order to look at the study area in more detail, I divided the five-minute service area based on each fire department. Since the service areas for each fire department overlapped with each other significantly, I only highlighted the boundary lines of different service areas to provide better representations on the map. Map 3 demonstrates that the five-minute service area to the extent fire stations overlapped each other, therefore, covering the entire study area. As shown in Table 1, fire department #1 shows the largest service area coverage of 9708 acres, while fire department #44 only has 5528 acres of service area with five fire apparatus units. In addition, fire department #12 has only one fire apparatus unit and it covers 7538 acres which seems to be inefficient. Although the five-minute service area covers the entire study area, this result raises questions about safety issues regarding its practical feasibility to respond to future emergency calls. Therefore, using the data from Table 1 and Map 3, I was able to locate the potential site for a new fire department that would enhance the quality of fire service provided in any vulnerable region.
Table 1
| Fire Department # | Number of Apparatus Units | 5 mins. Service Area Coverage (acres) |
| 1 | 4 | 9708 |
| 12 | 1 | 7538 |
| 16 | 4 | 7082 |
| 42 | 2 | 7051 |
| 44 | 5 | 5528 |
| 47 | 2 | 8417 |
| 50 | 2 | 8511 |
| 55 | 4 | 7735 |
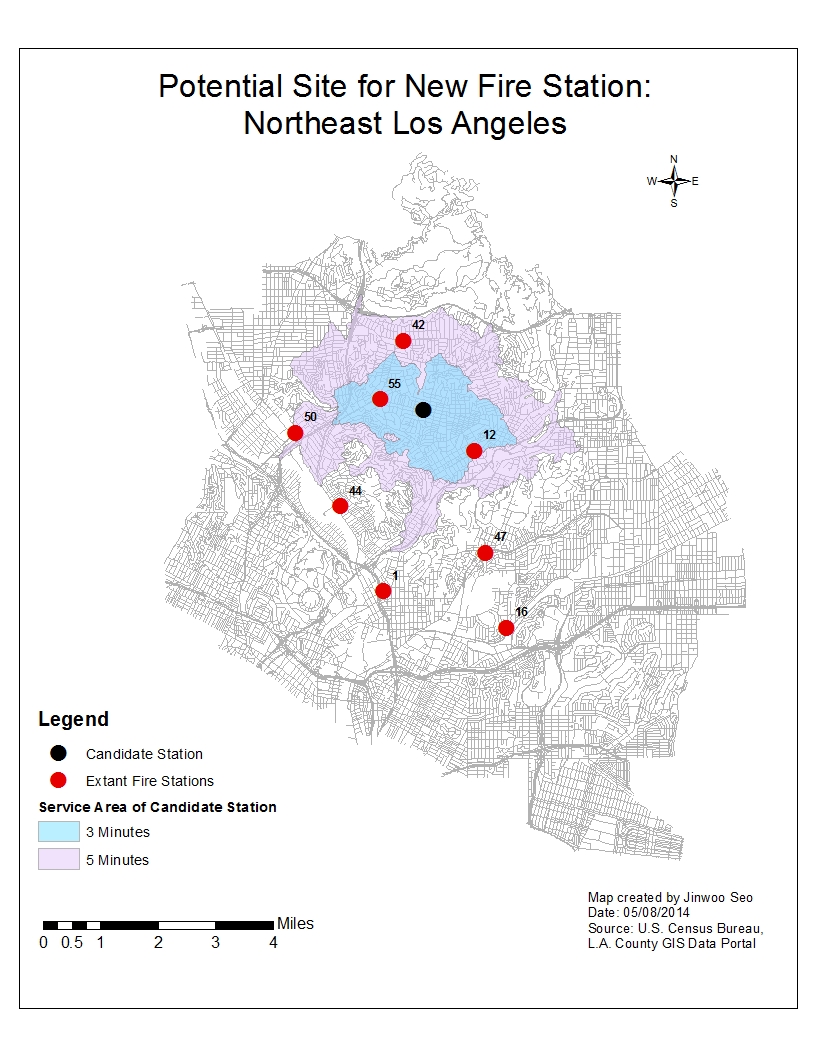
To locate a new fire department, I applied a location-allocation analysis using the network analyst tool of ArcGIS. I used a maximize coverage option for the new station to serve the maximum population (or demands) within the travel time of five minutes and I compared the total population within the subject area with the number of fire apparatus units equipped for each station. As a result, I was able to locate a new fire department as shown in Map 4. The potential site is located near the center of Northeast L.A. and surrounded by the two closed fire stations (#12, and #55). This result implies that fire station #12 and #55 are less effective in providing sufficient fire services to the nearby neighborhood than other parts of the city. The potential site is located in a densely populated area and should be considered by the city to improve its fire services.
Map 4
This analysis focuses on finding the vulnerable neighborhood with a lack of fire service to locate a new fire department. Although the current five-minute service area covered the entire study area, I was able to detect a vulnerable area using the techniques mentioned earlier. Having an additional fire department in the potentially vulnerable neighborhood or investing in more fire apparatus would improve the quality of fire service. However, this analysis lacks other necessary data such as traffic flow information, road conditions, and the capacities of the fire departments. With those data, I would have more criteria for evaluating the quality of fire services and locating a new fire station.
Contact: SEO35(AT)ILLINOIS(DOT)EDU
Disclaimer: This study was conducted as part of a course requirement for UP 418 (GIS for Planners) at the University of Illinois at Urbana-Champaign. As a class project it may lack analytic rigor, data accuracy, and validity. Findings of this study can only be shared, disseminated, or reproduced after getting consent from the student and the instructor.